Google Analytics provides an in-depth analysis of a website’s data in a comprehensive reporting interface. From detailed audience demographics to individual page performance metrics, the platform boasts extensive data viewable in both standard and customizable reports. The overwhelming amount of information available in Google Analytics, however, can make it difficult to determine which insights are most valuable without getting too entwined in the details. Follow the 5 steps below to use Google Analytics to quickly understand how your digital marketing strategy is working.
#1. Check Overall User Behavior
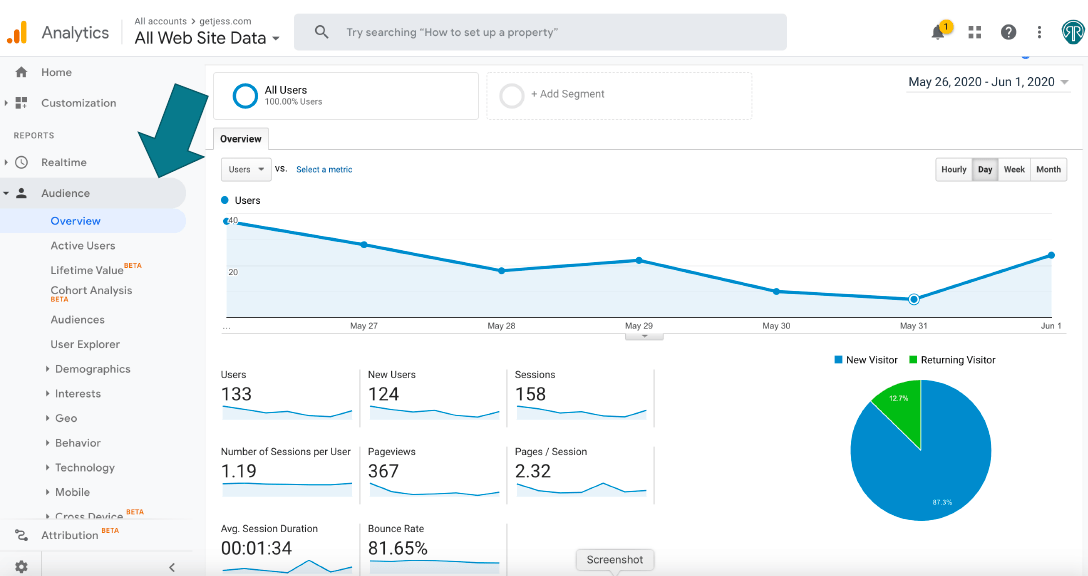
Audience > Overview
Learn how users interact with your website with the Audience report. Here, you will find a snapshot of your existing audience with information on new and returning visitors, the average length of time users are spending on your website, the average number of pages people are viewing, and more. Additionally, you can change the date range to analyze data over a specific time frame or compare data over two different periods of time to check for user behavior trends.
#2. Review the Source of Your Traffic
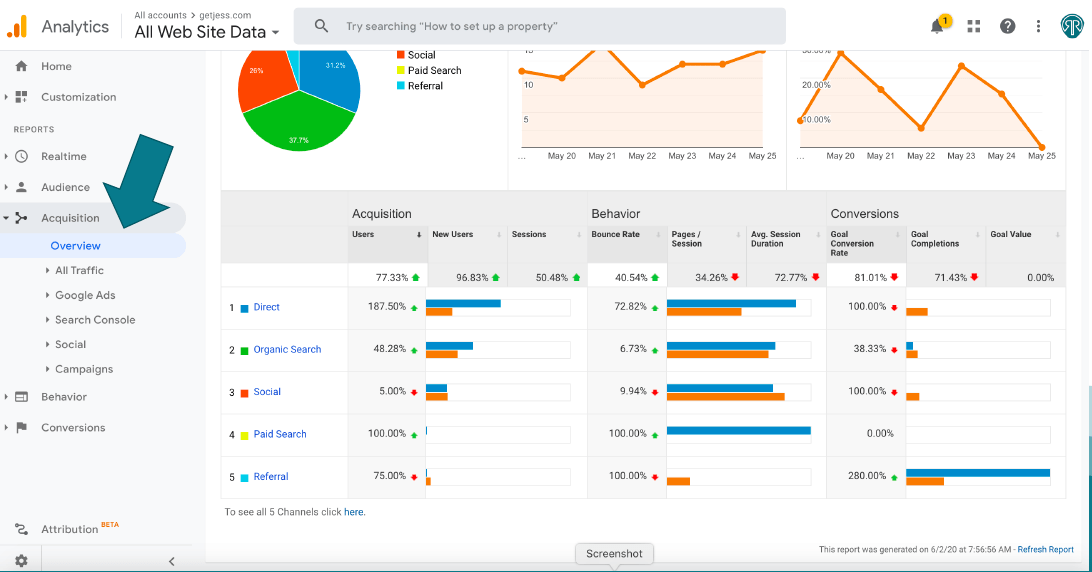
Acquisition > Overview
Acquisition reporting gives you insight into the effectiveness of your marketing strategy by helping you understand how people are finding you. In the Overview, Google Analytics outlines your direct, paid, organic, social, email, and referral traffic so you can easily compare the various channels funneling users to your website. If you want a more granular view, however, head to Source/Medium under All Traffic within Acquisitions. This report breaks down the source of your traffic to the specific site or network and includes the associated medium of each source. For example, Google/Paid would indicate your traffic came from Google by means of a paid advertisement.
#3. See Which Pages Matter Most
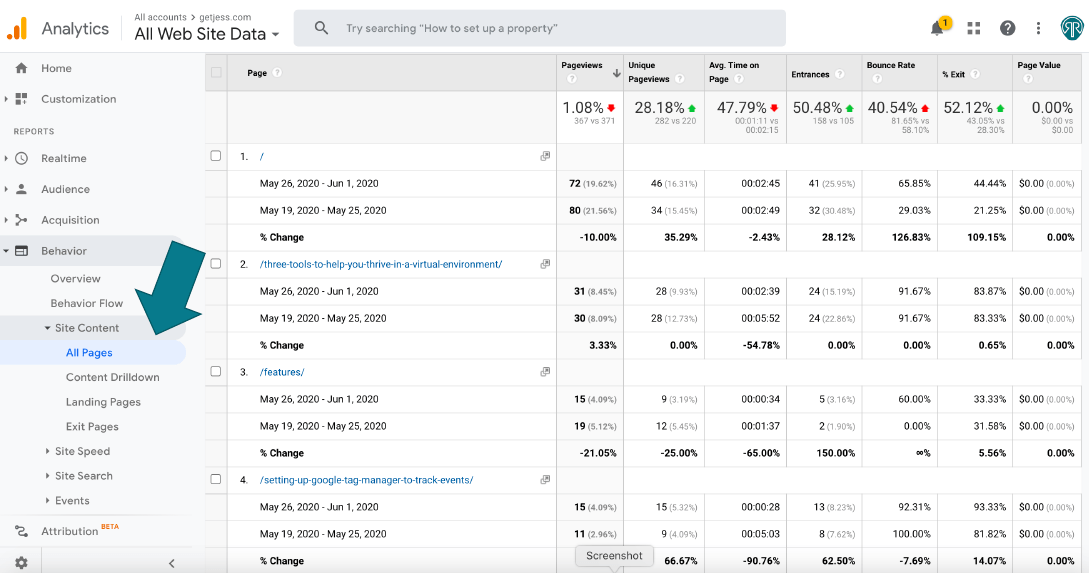
Behavior > Site Content > All Pages
Now that you know how people are getting to your website, it is important to understand which pages best engage website visitors. Under Behavior, navigate to Site Content then All Pages. This analysis allows you to see the pages users are visiting the most and the least, the pages visitors are spending the longest and shortest amount of time on, and more. You can use this information to optimize the lowest-performing pages to improve your website’s overall user experience.
#4. See Where People Entered the Site
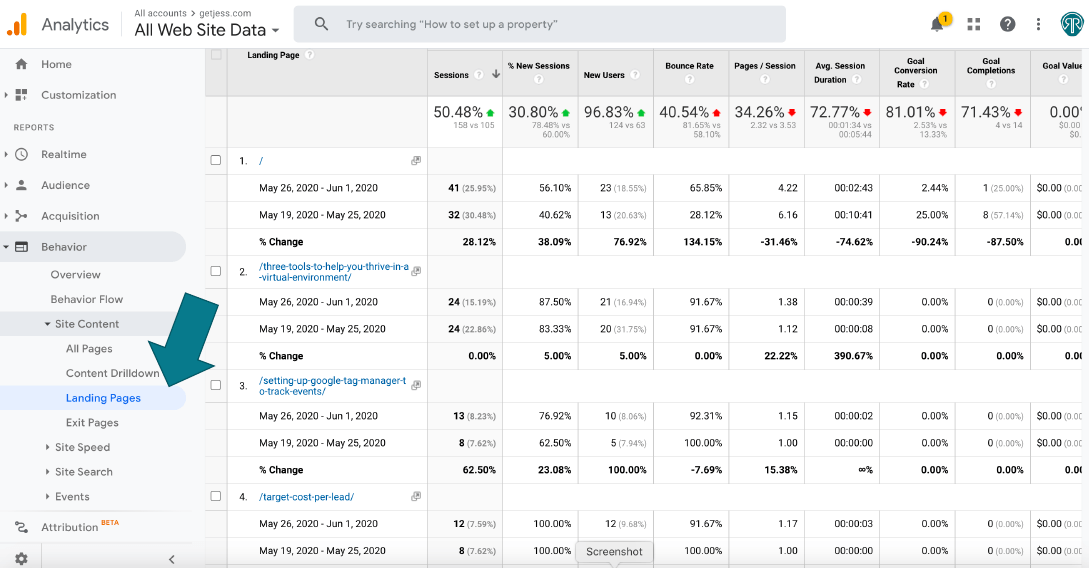
Behavior > Site Content > Landing Pages
Similarly, monitoring the pages where people most frequently enter your site can provide you with additional opportunities to improve a user’s experience right away. Below All Pages, you will see a tab for Landing Pages. This view specifically tracks first-time interactions on all of your pages. While you may be tempted to focus solely on updating your homepage, this data reminds you that many users’ first impression of your site is from other pages. If you use SEO as a marketing tactic, you’re probably making updates throughout your site and likely seeing many visitors entering from pages other than your homepage.
#5. Review Conversions
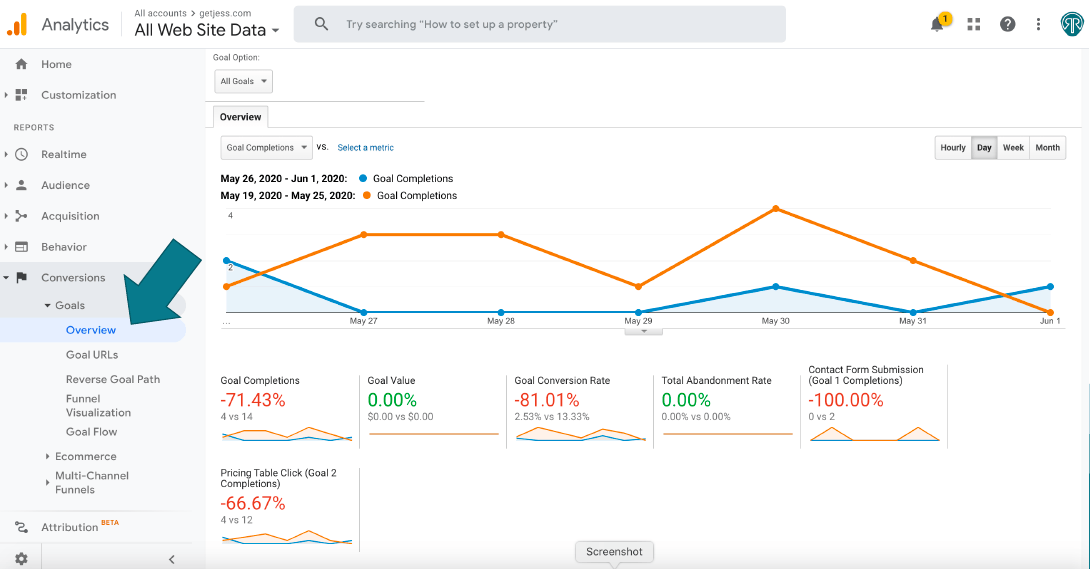
Conversions > Goals > Overview
Conversions are completed actions on your website that represent a valuable goal for your business. Examples include phone calls and contact form submissions. Setting up conversion tracking with Google Analytics is a complicated process that involves a certain degree of technical expertise. Consequently, you may want to consider hiring a professional to help you get started. If you already have goals set up, you’re can see results by clicking Conversions and then Overview. On this dashboard, you will see the page locations on which a goal completion which tells you the pages are most successfully driving leads. Click Source/Medium to see the sites and marketing campaigns that brought users to your website who converted. This screen shows you which of your marketing efforts are delivering results.
While Google Analytics has its limitations, overall, it offers businesses valuable insights into the effectiveness and deficiencies of their digital marketing strategies. This how-to guide on reading Google Analytics is a cheat sheet that will help you get started, access the most actionable data available within the platform, and avoid getting overwhelmed by the massive amount of data.
If you have any additional suggestions or questions about reviewing Google Analytics, comment below. If you liked this article, subscribe to our newsletter for more marketing tips!


0 Comments